The 60/40 portfolio: Losing its balance
 and Ajay Johal are investment managers at Ruffer LLP")
The 60/40 portfolio has served investors well for the past 50 years (1). It has been the allocation of choice for traditional balanced portfolios—60% in equities for the good times, 40% in bonds for the bad (and for the yield).
The past 50 years have been characterised by falling interest rates, low inflation and low volatility. A superb environment for both bonds and equities. But we may be entering a regime change which could see these conditions reverse.
In the following six charts, we’ll look at why the 60/40 portfolio worked, why it may be vulnerable now, and why, in the years ahead, investors may need something different.
1 Strong risk-adjusted returns

Source: Global Financial Data Inc
Equities have performed best. A buy-and-hold strategy has worked perfectly for investors who haven’t needed to draw on their portfolios. In times of market stress, bonds have dampened portfolio volatility. Having 40% of the portfolio in bonds helped investors during the dot.com bust and the Great Financial Crisis (2).
However, most investors need to draw cash from their portfolios at some point, which means that volatility or standard deviation becomes relevant—particularly over shorter time periods. The standard deviation of a portfolio comprised solely of equities was significantly higher than the standard deviation of a 60/40 portfolio, but only improved the annualised return by 0.8% (3). In other words, the 60/40 portfolio has achieved better risk-adjusted returns.
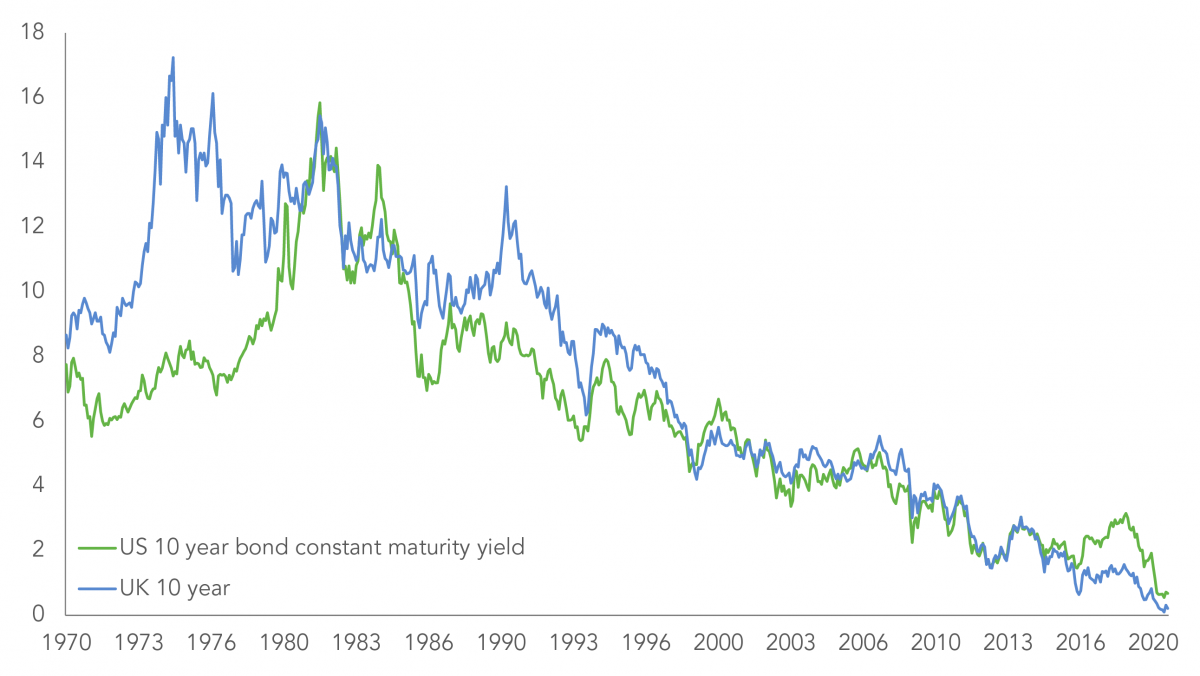
2 Interest rates have been falling since 1981
Source: Global Financial Data Inc
Several disinflationary forces have prevailed over the past half-century. Ageing demographics, the growth of IT, the re-emergence of China and globalisation amongst others. These forces have kept a lid on inflation and allowed central banks to operate without worrying too much about rising consumer prices. As a result, interest rates have been steadily falling. As rates and yields have fallen, bond prices have risen, so have the price of equities. Both bond and equity markets have had a 40-year tailwind of falling interest rates. Interest rates can’t fall much further from here—so what does the future hold for bonds?
3 Bonds cannot offset falling equities
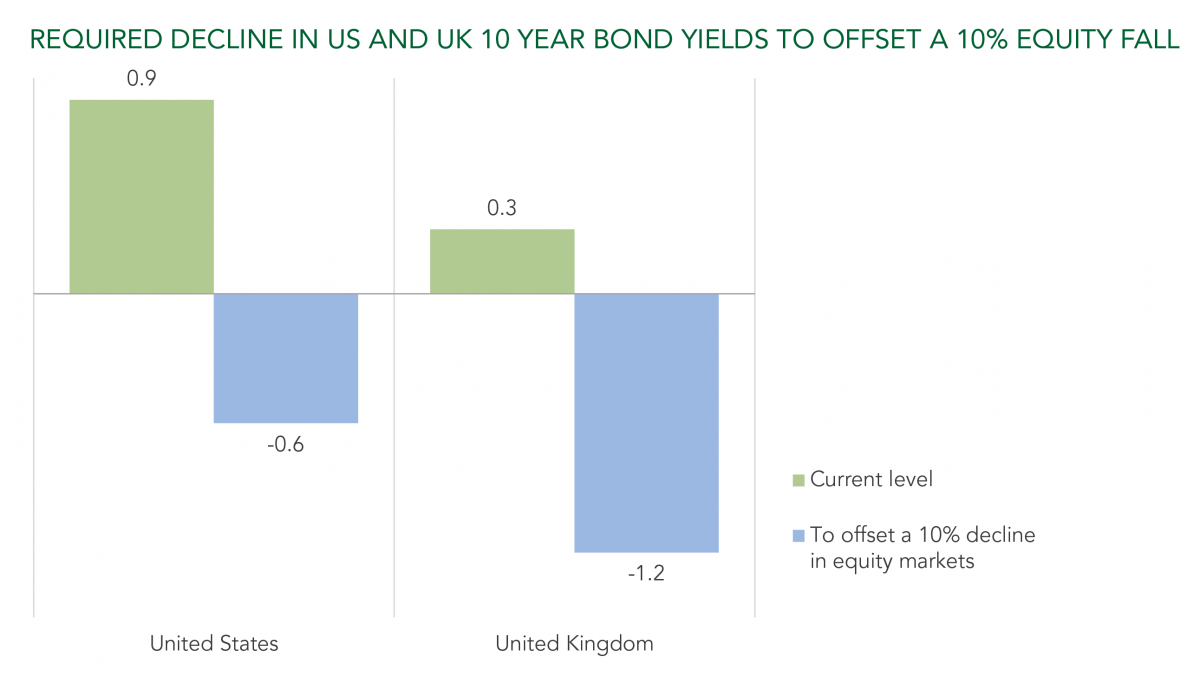
Source: Bloomberg, Morgan Stanley and Ruffer analysis. Assumes bond exposure is all to the benchmark 10-year issue. Data as at November 2020
Bonds have historically acted as an offset to equities in market crises.
But this chart demonstrates that bonds are very unlikely to do this job in the future. The blue bars illustrate how far yields must fall to offset a 10% decline in equity markets for a 60/40 portfolio.
With bond yields already so low, there is no scope for the multi-decade bull market in bonds to continue indefinitely. From this point there appears to be an asymmetric risk; bonds provide poor (in some cases negative) yields and limited downside protection.
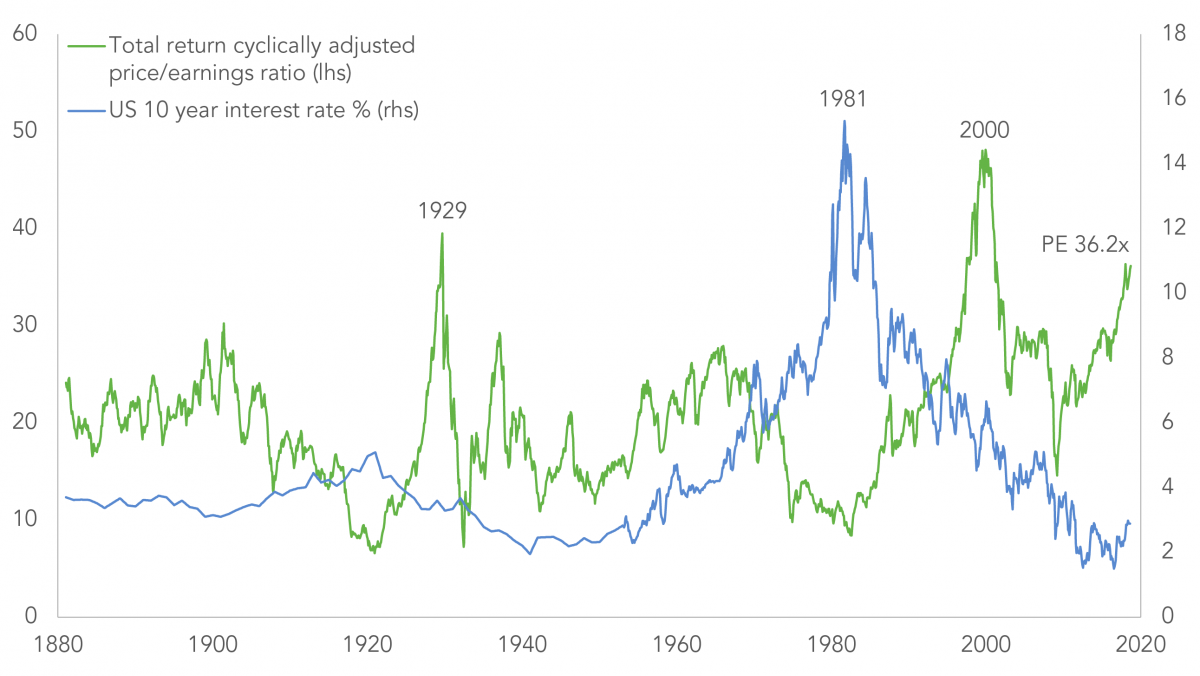
4 Bonds and equities at all-time highs
Source: Robert J Shiller, Princeton University Press
Both bonds and equities trade at valuations close to all-time highs. Yes, if rates are low, then using a discounted cash flow to value stocks (estimating the present value of future earnings) goes some way to justifying record-high valuations. Yet by whichever metric you choose to use, equity valuations appear stretched.
But valuations don’t tell the whole picture. Seven stocks now account for more than 25% of the value of the S&P 500 (4). This narrow market leadership represents a very crowded momentum trade, a trade that hides a worrying fragility.
Momentum can reverse quickly, such as in November 2020, when news of an effective vaccine caused 10-15% to be wiped off the value of several major tech stocks—the lockdown winners—in one day (5). Bonds did little to protect portfolios on that day.
5 60/40 portfolios are vulnerable to inflation
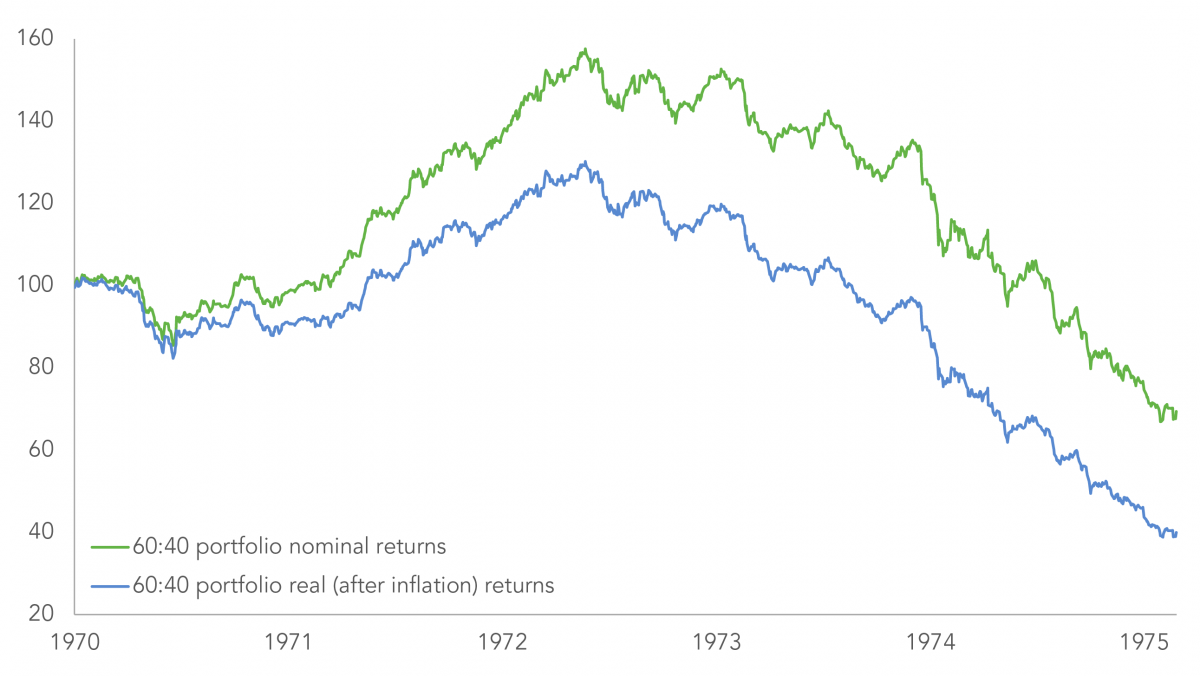
Source: Global Financial Data Inc
Nominal returns in the 1970s were reasonable, but when you factor in the high inflation, the picture changes. You lost 60% of the real value of a 60/40 portfolio between 1970 and 1975 (6).
Most investors alive today have never encountered significant inflation. Quantitative easing boosted asset prices but had no impact on consumer prices. Investors do not believe that inflation is coming. However, the deflationary forces of the past five decades are waning and the response to the pandemic has seen a monumental rise in government spending. Most central banks have used rhetoric suggesting they are willing to let inflation overshoot their targets. The inflationary chips are stacking up.
Inflation is a menace worth protecting against. It is a major risk to the conventional 60/40 portfolio. Equities suffer, as the experience of the 1970s shows, but their earnings will eventually grow as prices rise. Inflation is a much bigger risk to bonds – they will not protect the real value of portfolios. Alternative assets are required.
6 Ruffer improves returns and lowers risk
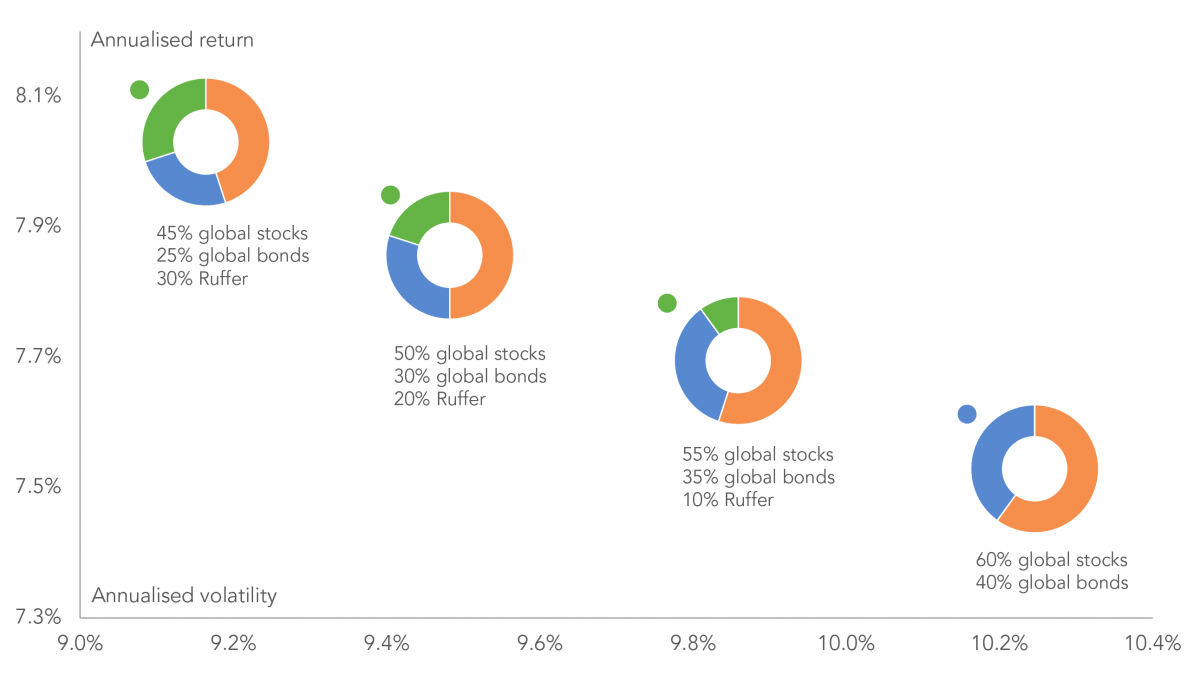
Source: Ruffer, FactSet, MSCI World TR Index, unhedged returns in GBP, Bloomberg Barclays Global Aggregate TR Bond Index, unhedged returns in GBP. Assumes quarterly rebalancing. Data from 30 June, 1995 to 30 September, 2020
The key to survival will lie in diversifying beyond the traditional balanced portfolio.
In a market regime change, in which equities and bonds fall together, investors will need an asset with low correlation to these markets, and negative correlation at points of stress. Traditional alternatives are often pseudo equities, so a genuine diversifier is required within portfolios. Ruffer is one such example, providing positive returns through the dot.com bust, the credit crisis and most recently in the Covid-19 shock.
This chart shows how the introduction of Ruffer to a balanced portfolio has improved risk-adjusted returns over the last 25 years. Ruffer’s all-weather approach means that we are not tied to benchmarks. This allows us to challenge market certainties. The result is a genuinely different return profile. One which can enhance the traditional balanced portfolio, decrease volatility and improve returns over the long-term.
1 Global Financial Data Inc
2 Global Financial Data Inc, Ruffer analysis
3 Ibid
4 S&P Dow Jones Indices, Bloomberg 30 October, 2020
5 Bloomberg 9 November, 2020
6 Global Financial Data Inc
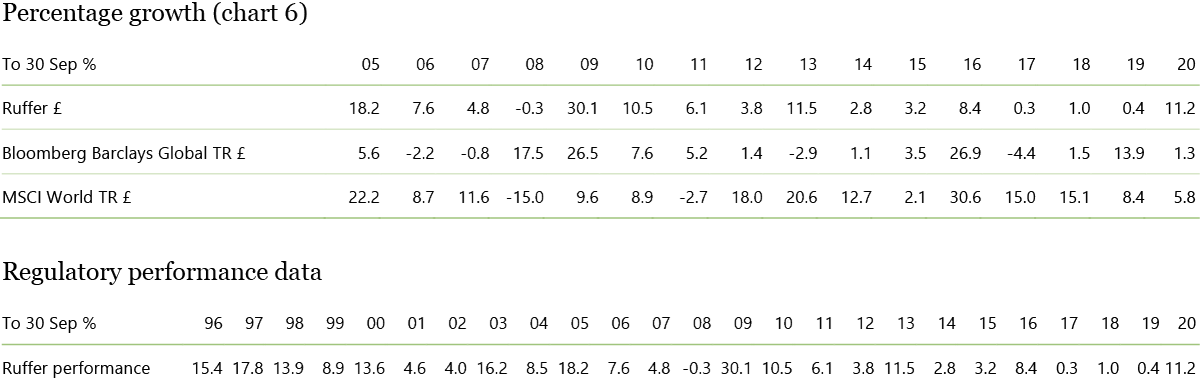
 Source: Ruffer, Bloomberg, MSCI. Ruffer performance is shown after deduction of all fees and management charges, and on the basis of income being reinvested. Please note that past performance is not a reliable indicator of future performance. The value of the shares and the income from them can go down as well as up and you may not get back the full amount originally invested. The value of overseas investments will be influenced by the rate of exchange. Calendar quarter data has been used up to the latest quarter end. Ruffer LLP is authorised and regulated by the Financial Conduct Authority. This document, and any statements accompanying it, are for information only and are not intended to be legally binding. Unless otherwise agreed in writing, our investment management agreement, in the form entered into, constitutes the entire agreement between Ruffer and its clients, and supersedes all previous assurances, warranties and representations, whether written or oral, relating to the services which Ruffer provides.
† MSCI. The MSCI information may only be used for your internal use, may not be reproduced or redisseminated in any form and may not be used as a basis for or a component of any financial instruments or products or indices. None of the MSCI information is intended to constitute investment advice or a recommendation to make (or refrain from making) any kind of investment decision and may not be relied on as such. Historical data and analysis should not be taken as an indication or guarantee of any future performance analysis, forecast or prediction. The MSCI information is provided on an ‘as is’ basis and the user of this information assumes the entire risk of any use made of this information. MSCI, each of its affiliates and each other person involved in or related to compiling, computing or creating any MSCI information (collectively, the ‘MSCI parties’) expressly disclaims all warranties (including, without limitation, any warranties of originality, accuracy, completeness, timeliness, non-infringement, merchantability and fitness for a particular purpose) with respect to this information. Without limiting any of the foregoing, in no event shall any MSCI party have any liability for any direct, indirect, special, incidental, punitive, consequential (including, without limitation, lost profits) or any other damages. (msci.com)